Paper on “Encountering Friction, Understanding Crisis” accepted at CHI'25!
We are glad to announce that our paper, "Encountering Friction, Understanding Crises: How Do Digital Natives Make Sense of Crisis Maps?" has been accepted at CHI'25 (ACM CHI Conference on Human Factors in Computing Systems)! Antonia Saske will present the paper at the conference in Yokohama, Japan, in late April.
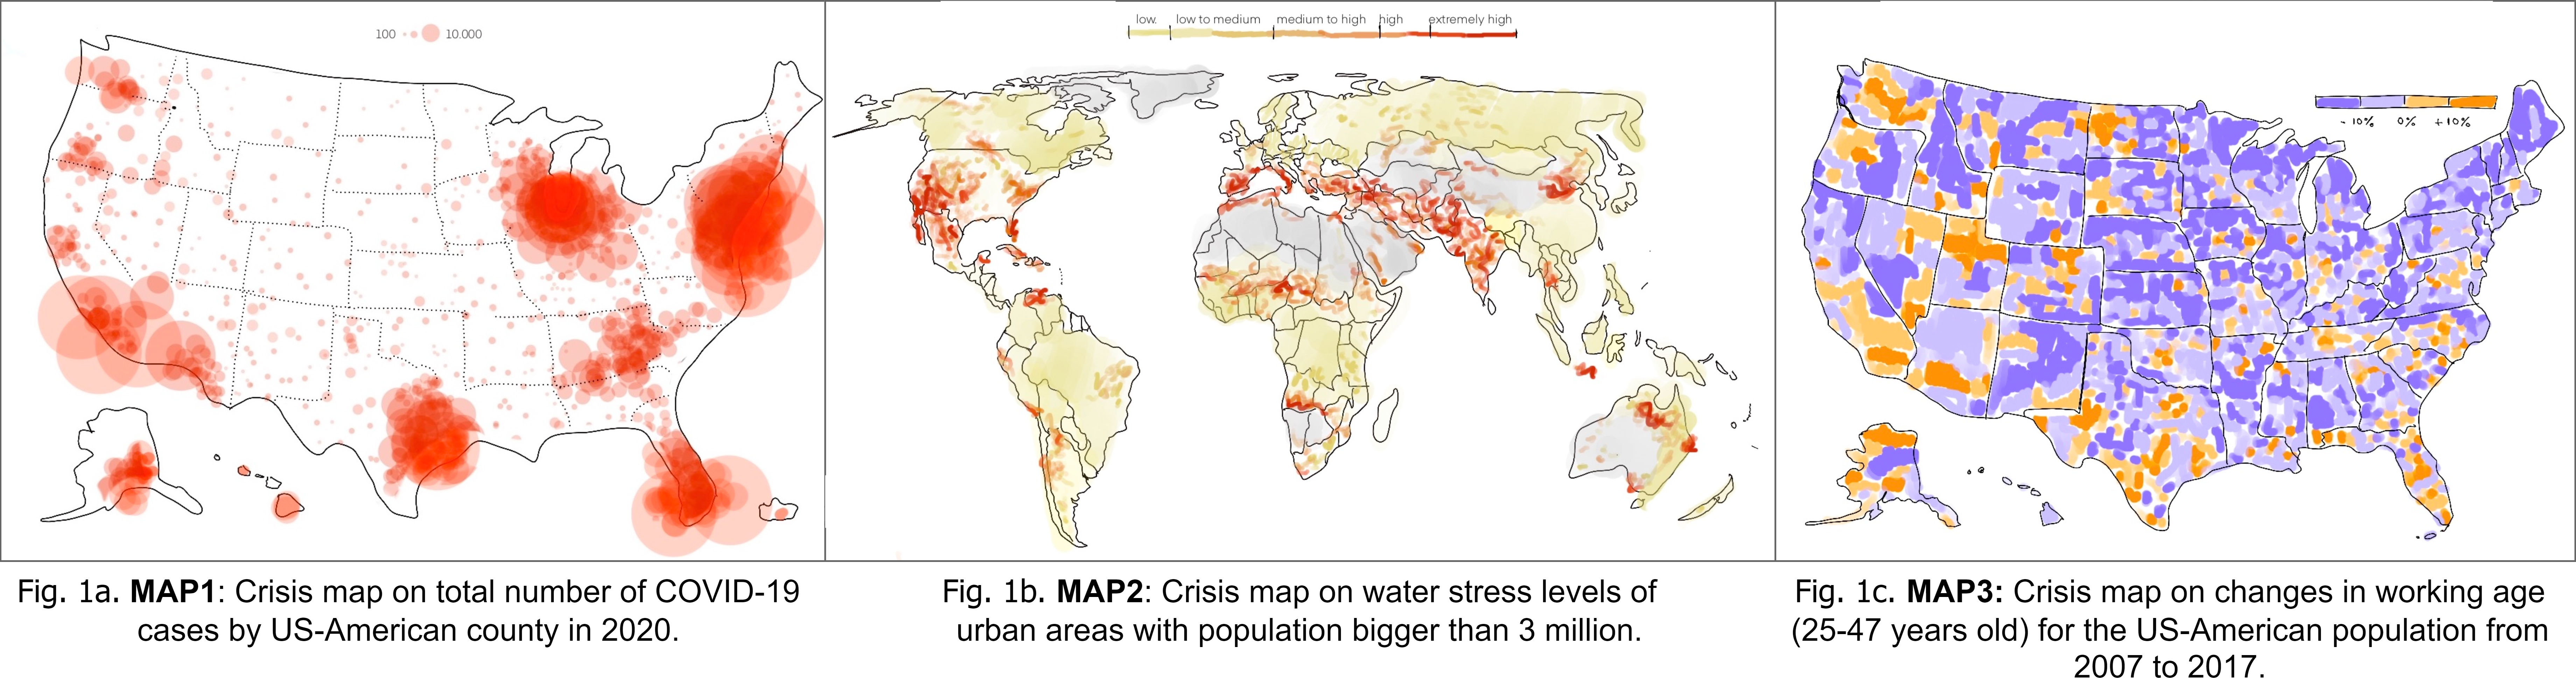
We investigated how young, digitally native audiences engage with crisis maps—critical tools for communication and decision-making during events like the COVID-19 pandemic and the ongoing climate crisis. Exemplary crisis maps are shown in the attached figure. Despite their importance, there is limited understanding of how non-expert audiences engage with these maps, a gap our study aims to bridge.
Our work combines two empirical studies: an analysis of online comments on a New York Times graph series and semi-structured interviews with 18 participants from German-speaking regions. We categorized viewers' sensemaking activities into four clusters, which are informed by a data-centric sensemaking framework[1]. We found that map viewers inspected the map, e.g. by exploring the map's layout, they engaged with the map's content, e.g. by analyzing data elements, and they also placed the map, e.g. by contextualizing information. Additionally, we introduced a new activity cluster, which captures that map viewers respond personally by showing affective reactions such as trust or concern.
We also identified friction points—key challenges that disrupt comprehension. These points include:
- Struggling with color encoding such as confusion about color associations like the usage of red water stress instead of for heat,
- Missing context such as finding labels unclear or provided background information insufficient,
- Lacking personal connection such as difficulty relating the map content to oneself, and
- Distrusting such as skepticism about data reliability or source transparency.
By addressing these friction points, our findings provide actionable insights to enhance the design of crisis maps, ensuring they better support non-expert audiences in making sense of visualizations with critical information.
Citation to paper: Laura Koesten, Antonia Saske, Sandra Starchenko and Kathleen Gregory. 2025. Encountering Friction, Understanding Crises: How Do Digital Natives Make Sense of Crisis Maps?. In CHI Conference on Human Factors in Computing Systems (CHI ’25) , April 26-May 1, 2025, Yokohama, Japan. ACM, New York, NY, USA, 15 pages. DOI: 10.1145/3706598.3713520
Keywords: Sensemaking, Human-Data Interaction, Data Visualization, Crisis Maps, Data Engagement, Friction Points, Crisis Communication, Public Data Understanding