Paper on Climate Vis Accepted for Publication!
We are thrilled to share that Regina Schuster's paper, titled “Being Simple on Complex Issues - Accounts on Visual Data Communication about Climate Change , has been accepted for publication in the IEEE Transactions on Visualization and Computer Graphics (TVCG) journal in 2024!
In a world where the impacts of climate change are becoming increasingly evident, the role of effective communication cannot be overstated. Climate data are increasingly communicated through visual formats, ranging from scientific data visualizations to colorful infographics. However, little research has focussed on how people interpret such data visuals, especially the ones we see in the news. Hence, our team looked into how climate change data is communicated and understood, focussing on the role that data visualizations, such as charts, play in conveying the complexities of this topic to a general audience.
The research journey: We engaged in conversations with 17 experts in the fields of climate change, data visualization, and science communication. Additionally, we sought the perspectives of 12 laypeople, that is persons without professional expertise in either of the three aforementioned fields. We asked participants questions about climate change communication and various aspects of data visualizations. We further asked them to share what they think is the main takeaway message for two climate change data visualizations (one example is shown below).
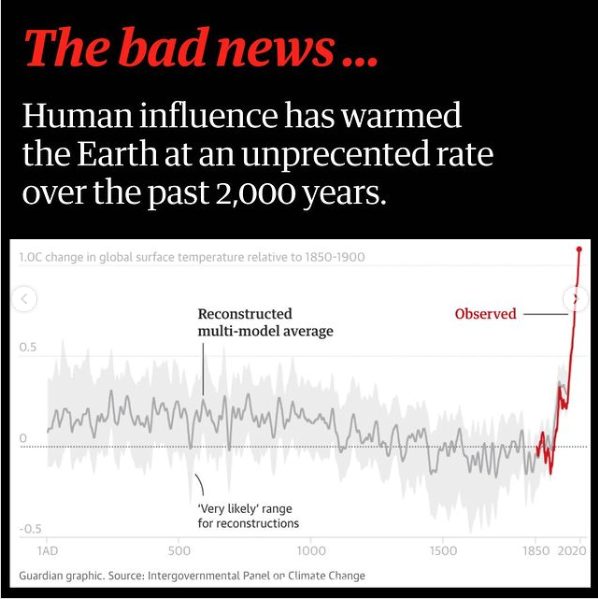
“It's clearly about the global surface temperature, again viewed over different years.
And
the
main message is now, if I look at 2020 for example, I see that the red line shoots up
here,
and
steeply at that. [...] A retrospect, where it was actually, I would say, relatively the
same
and
then a little lower and then it got higher again and now it is shooting up.”
(main takeaway message formulated by a lay participant)
“Climate change is human-driven.”
(main takeaway message formulated by an expert)
Key findings: Our analysis uncovered intriguing differences between and among participant groups.
- Experts tended to craft shorter and more abstract messages when making sense of the charts. Their focus was on higher-level conclusions rather than on specific details.
- Participants also formulated messages that highly differed in content. It was interesting to see how aspects crucial to one reader get ignored by others.
- Participants voiced diverse opinions regarding what makes (visual) climate change communication effective. The partially contradicting preferences stress the need for audience-tailored visualizations.
- Experts emphasized the importance of simplifying climate change communication to reach a broader audience, noting that people's visual data literacy may be overestimated in the visualization community.
Implications for effective communication: In our paper, we reflect on how these insights can inform the design decisions behind creating impactful data visualizations, especially in the context of news media sources targeting lay audiences. We explore finding the right balance between keeping things simple and ensuring they are accurate. We also discuss techniques to make visualizations not just informative but also captivating.
For anyone interested in reading the paper: R. Schuster, K. Gregory, T. Möller, and L.
Koesten, "Being
Simple on Complex Issues” - Accounts on Visual Data Communication about Climate Change,
in
IEEE
Transactions on Visualization and Computer Graphics, doi:
10.1109/TVCG.2024.3352282.
http://ieeexplore.ieee.org/document/10414428
We thank all interview participants for their time and valuable insights!