Podcast: Laura Koesten in Conversation
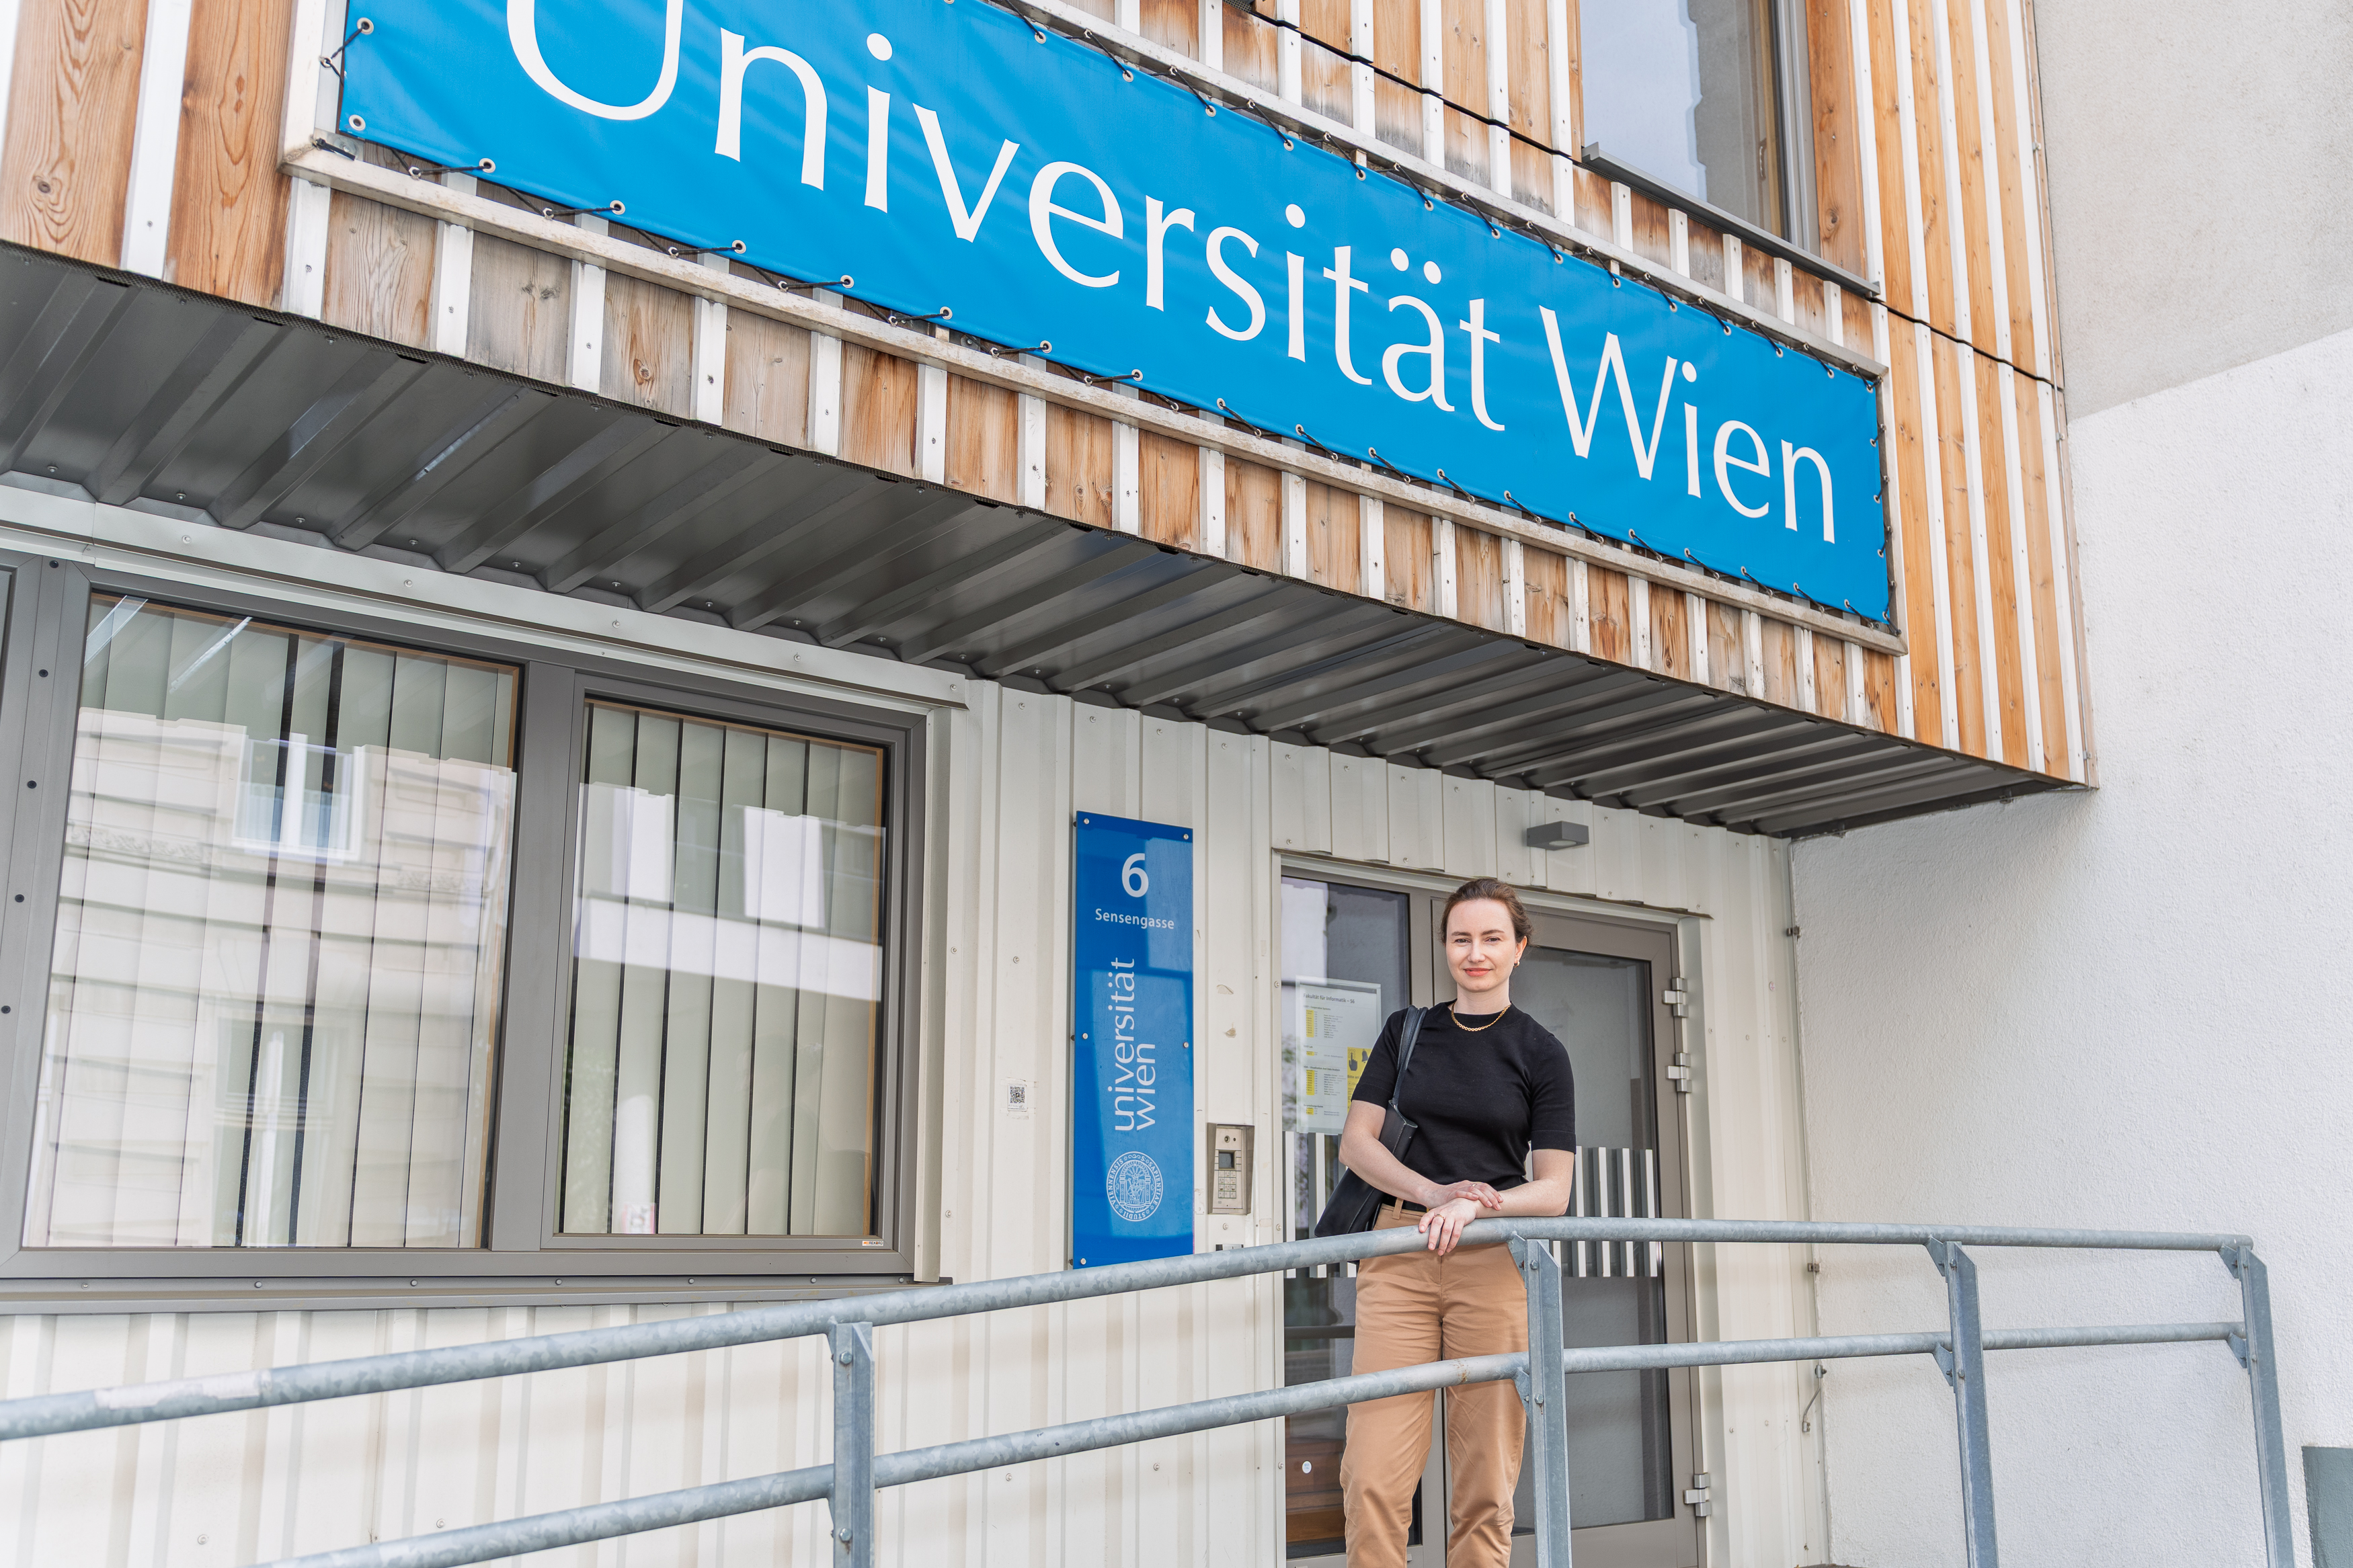
In the latest episode of An der Quelle, Laura Koesten talks about how we interact with data and why clear, simple, and context-aware visualizations matter.
Read more

Paper on "The Gulf of Interpretation" accepted at CHI'25!
Our CHI'25 paper examines the gap between how chart creators encode messages and how readers interpret them, highlighting challenges in chart comprehension and offering design insights for more effective data communication.
Read more
Paper on "Encountering Friction, Understanding Crisis" accepted at CHI'25!
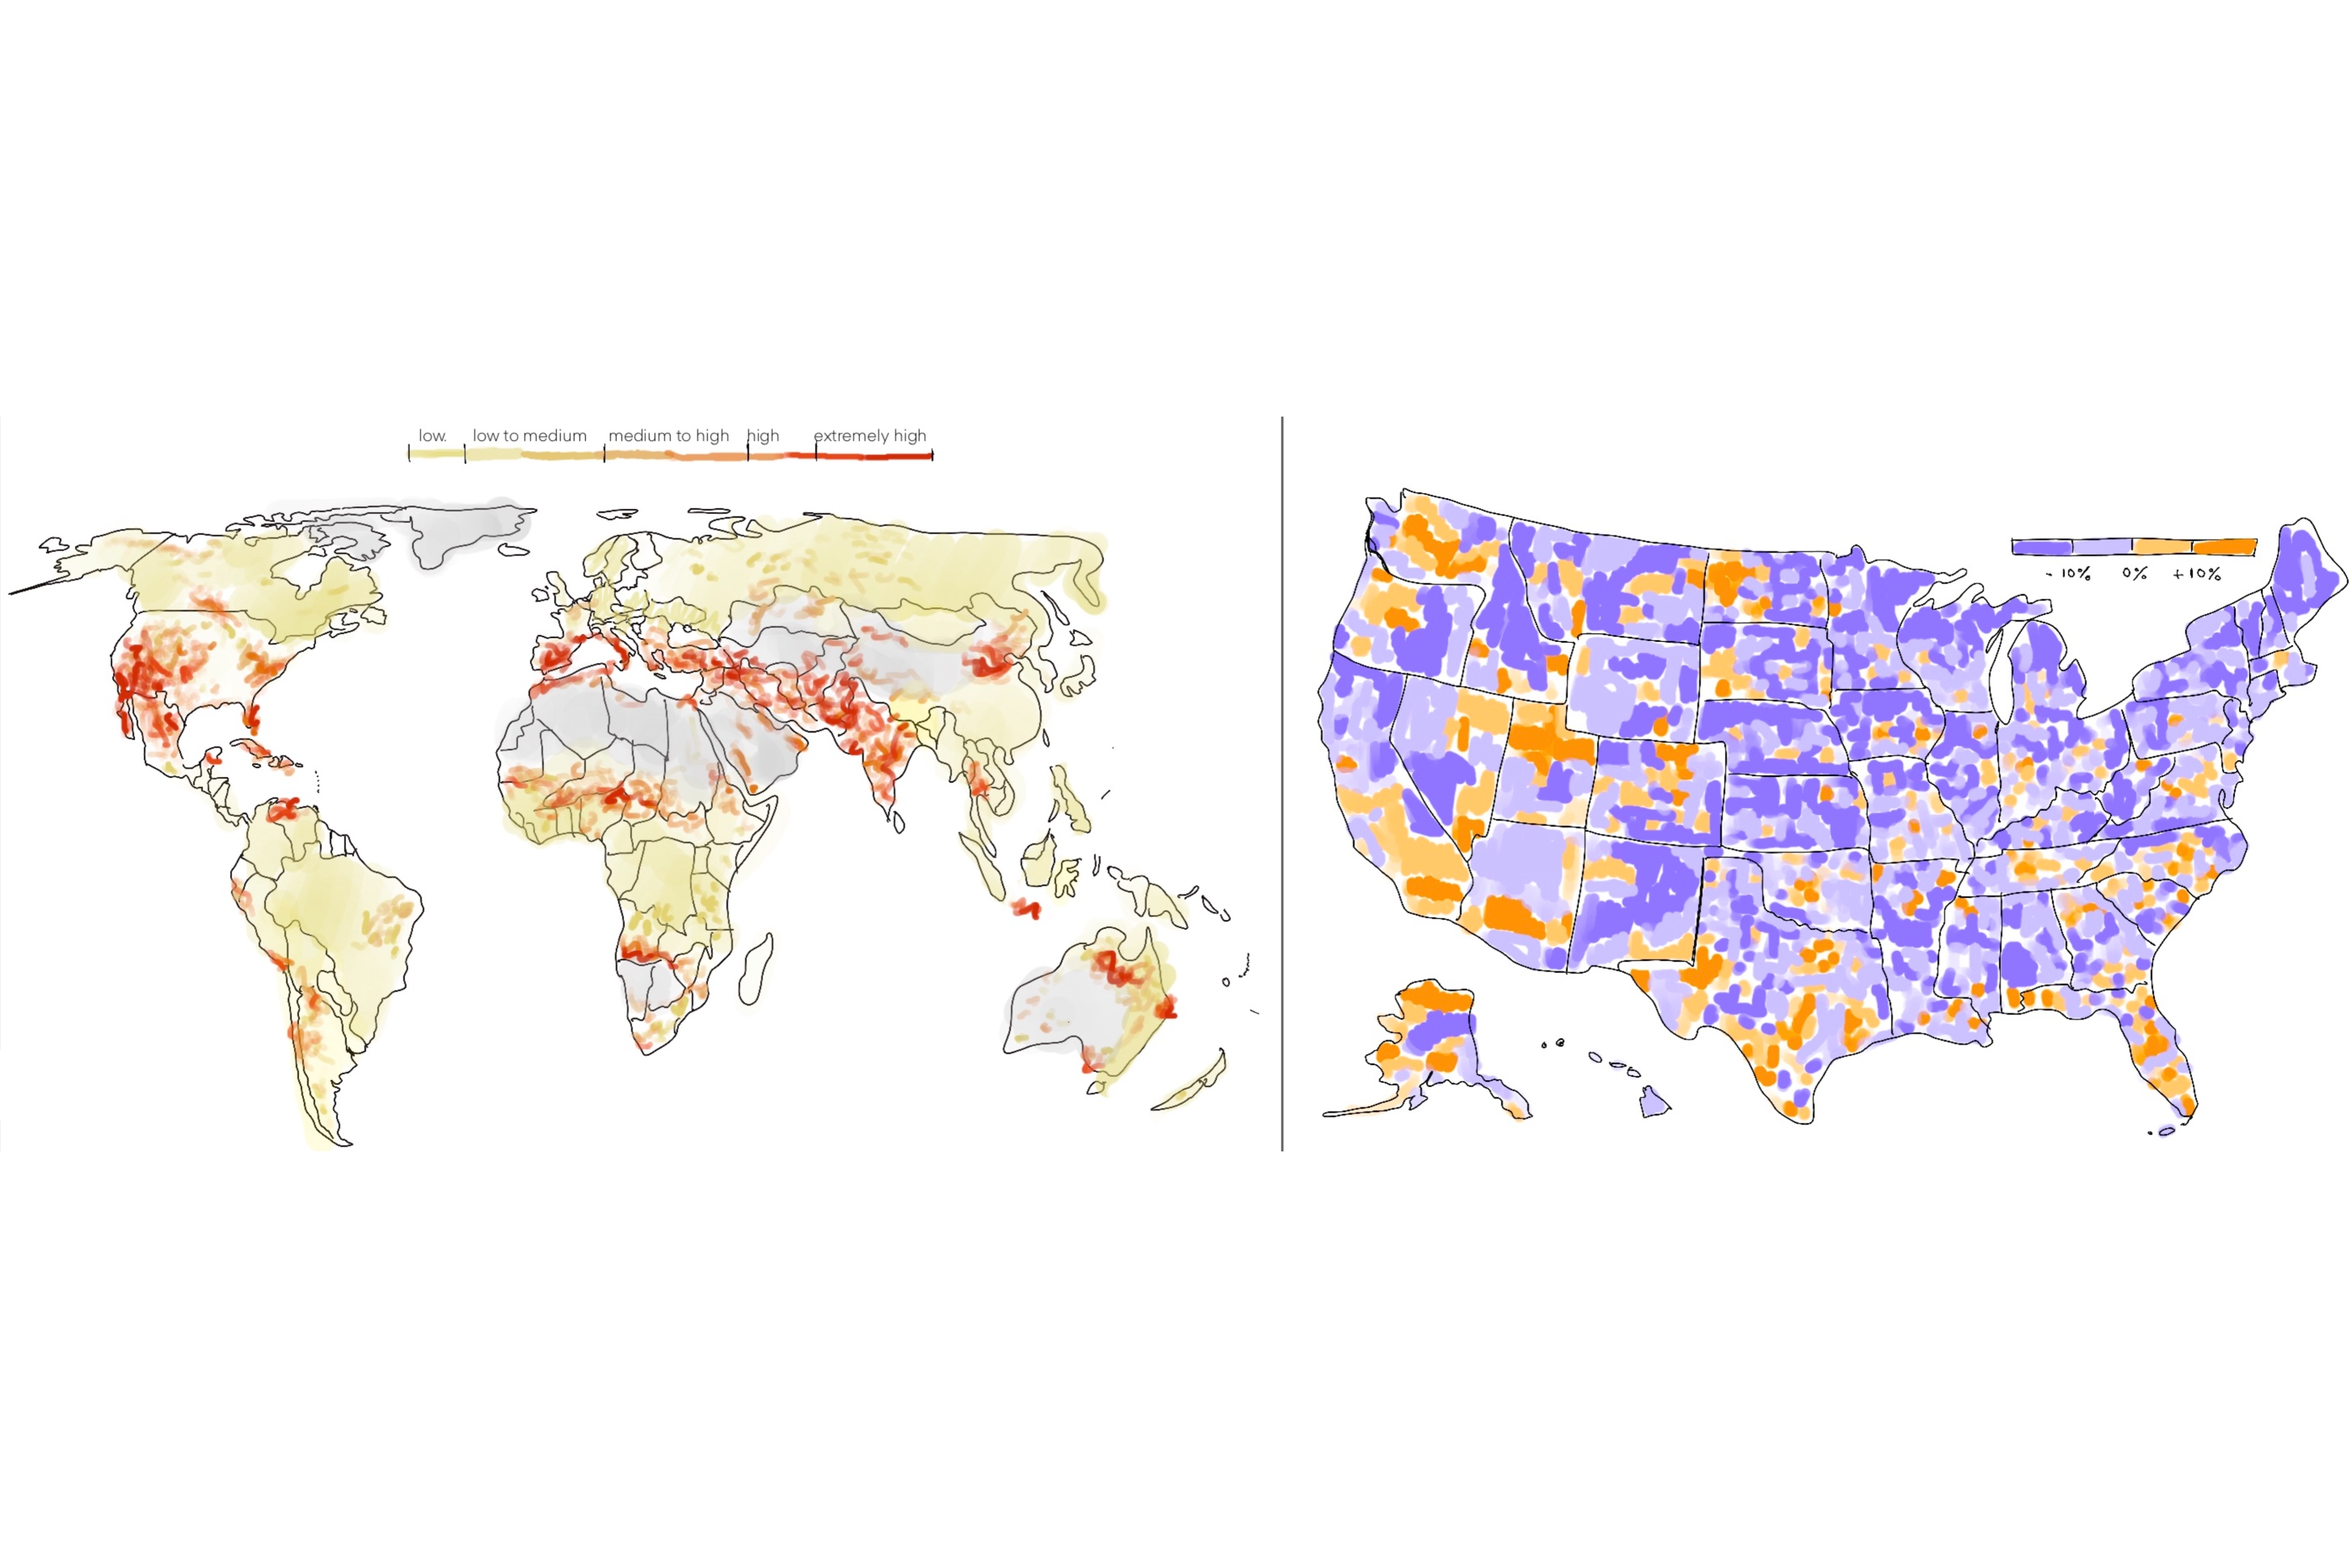
How do Digital Natives make sense of crisis maps? Our CHI'25 paper explores their engagement with these crucial visual tools, identifying key activities and discussing the impact of friction.
Read more

Workshop Highlight: Data Vis for All?
What makes a data visualization effective for different audiences? Our recent workshop in Vienna brought together experts to discuss engagement, trust and more.
More info
Meet the Science Center Network – A Collaboration for Climate Communication
We're excited to share our collaboration with the Verein ScienceCenter-Network! The Science Center Network is a nationwide organization in Austria that serves as a hub for interactive science engagement. ...
More info
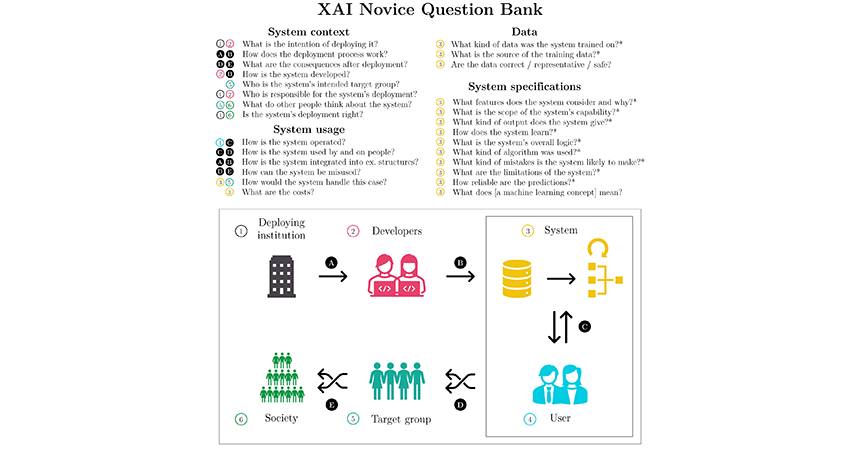
New Publication! Presenting the XAI Novice Question Bank – a catalogue of lay people’s information needs about AI systems
We are happy to announce that Timothée Schmude's paper was accepted to the International Journal of Human-Computer Studies!
More info

We are taking part in the Climate Change Visualization Project
Laura Koesten is Co-PI of this research project, which is exploring the impacts of different visualizations of climate change data.
Find out more
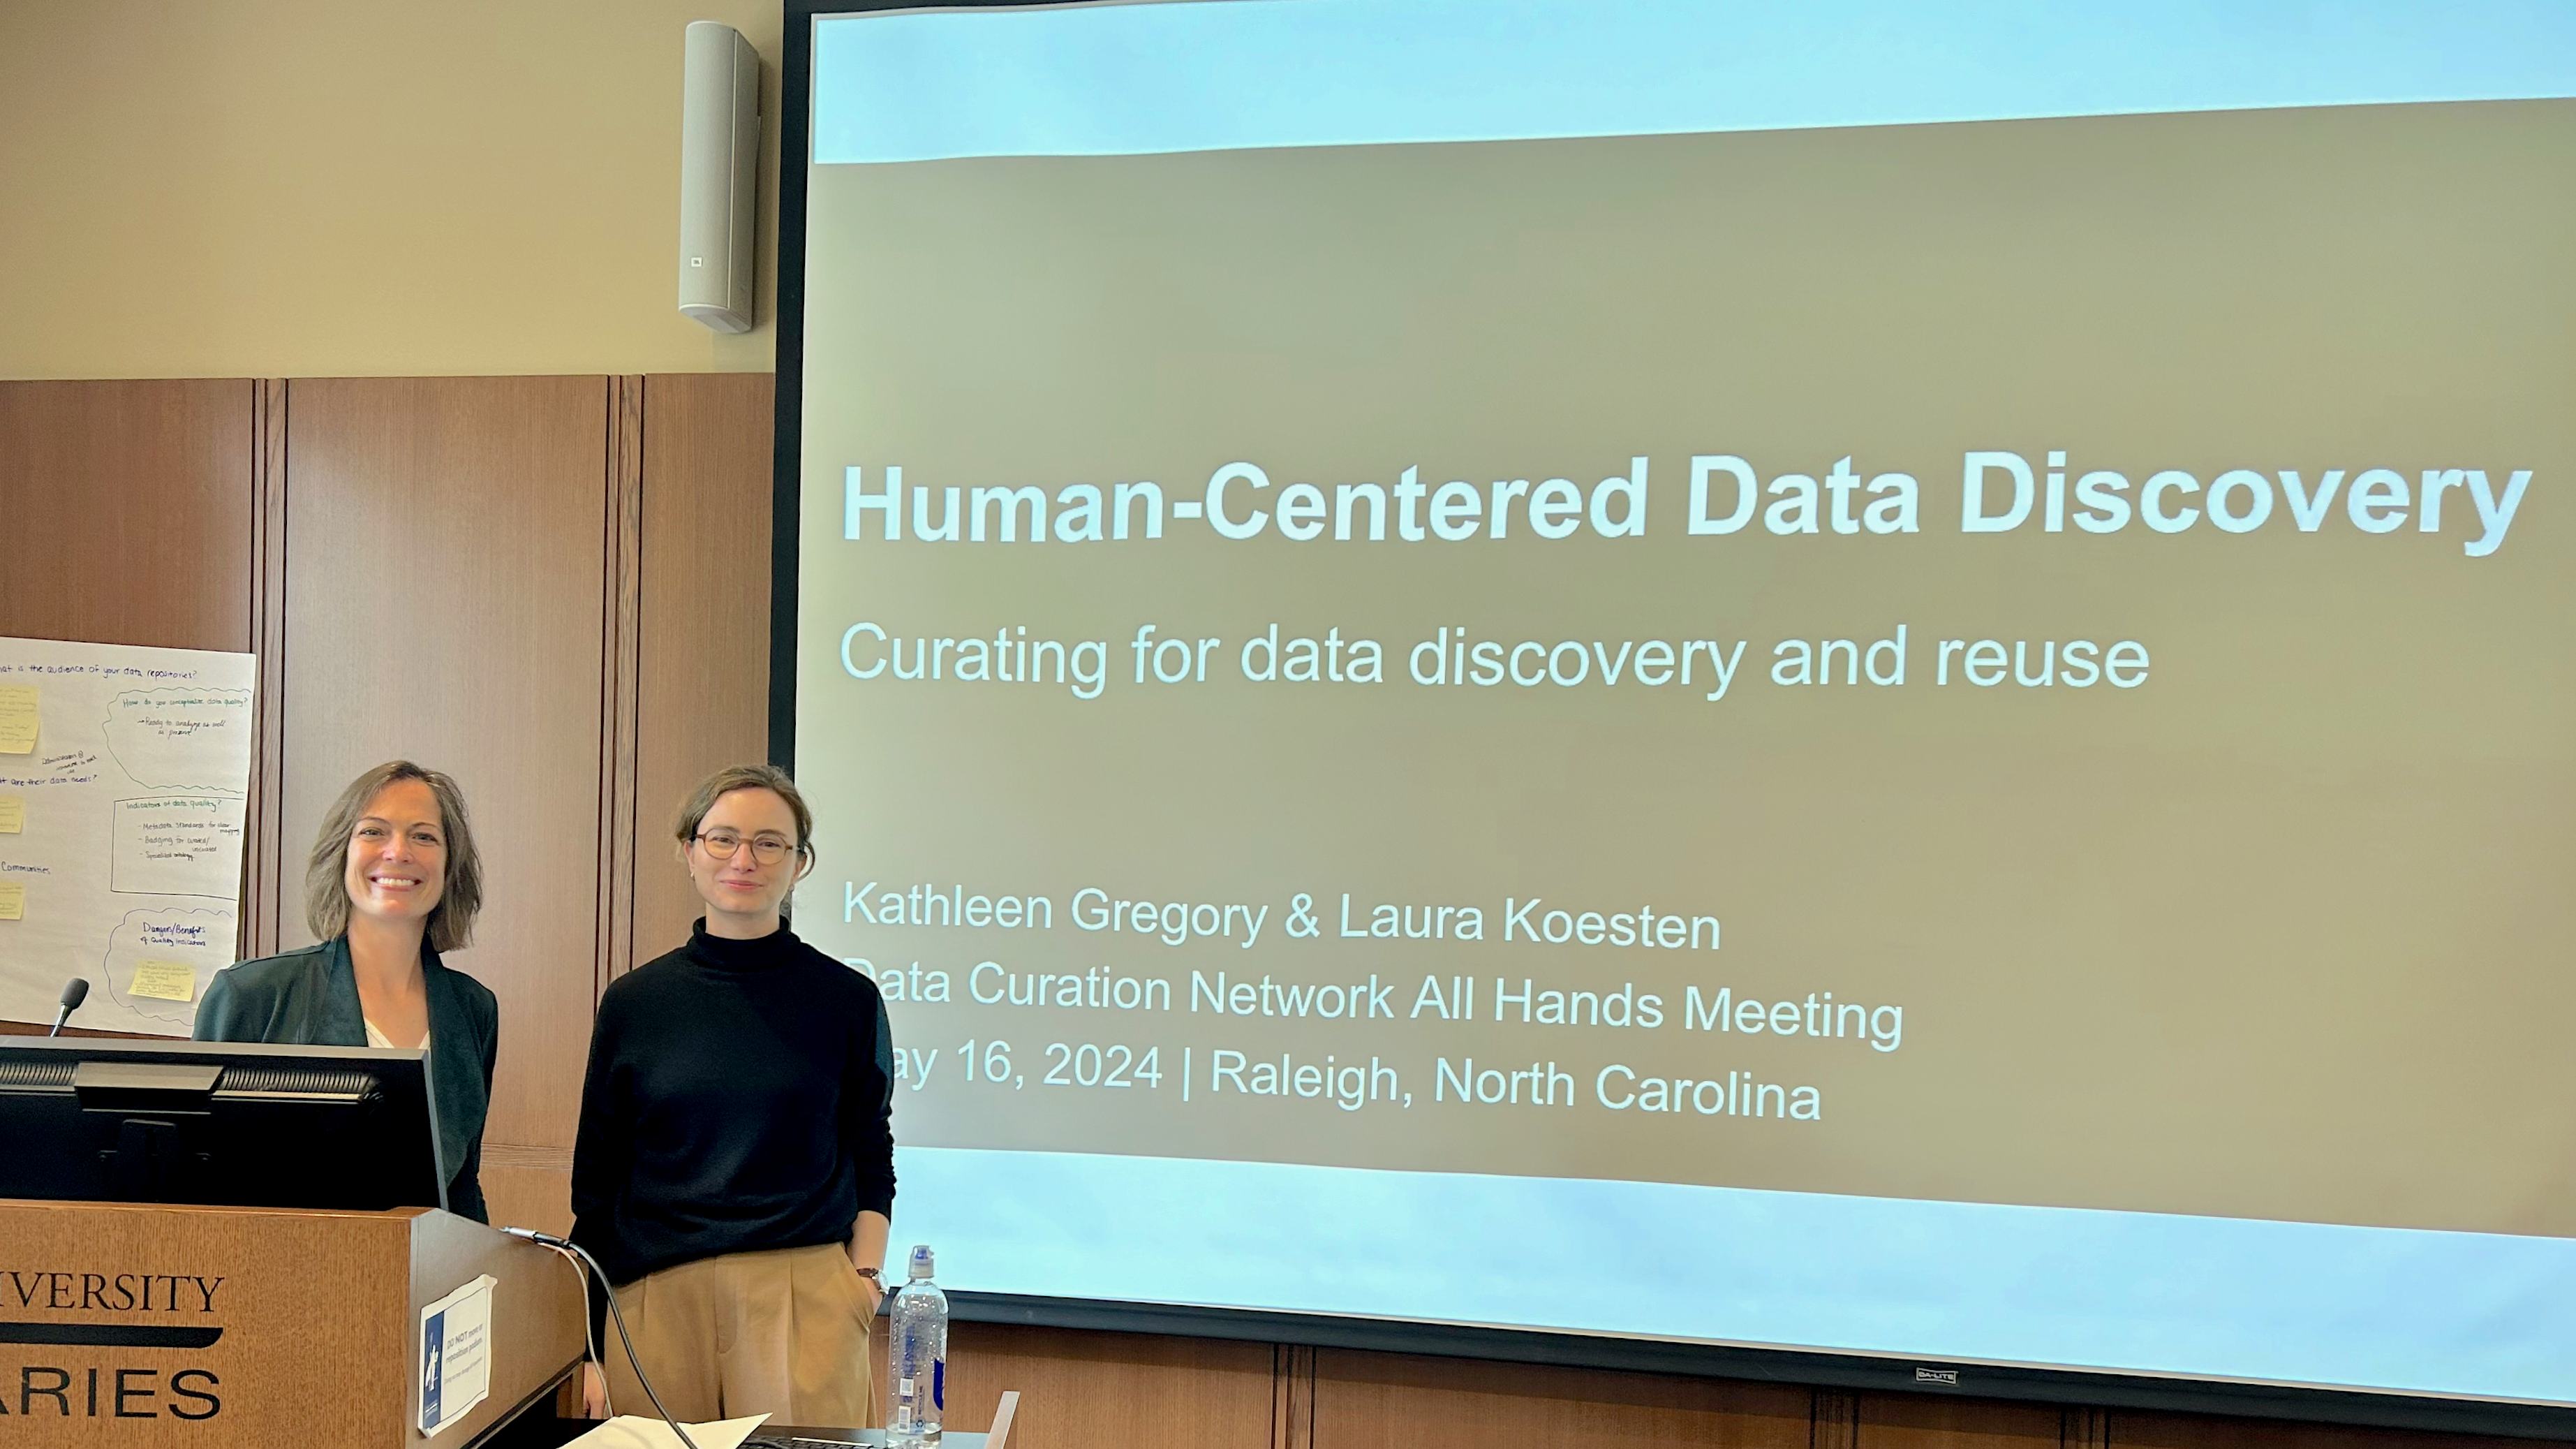
Workshop on "Human-Centered Data Discovery"
Laura Koesten and Kathleen Gregory recently conducted a workshop on "Human-Centered Data Discovery" for the Data Curation Network.
Read Blogpost
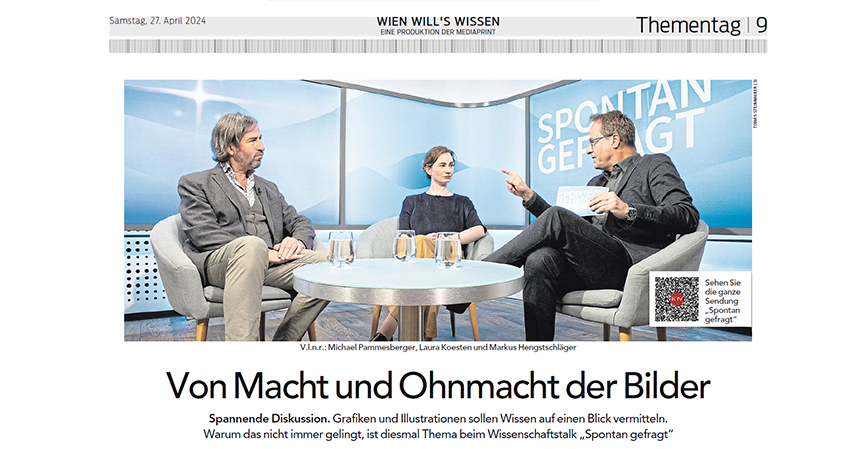
Laura Koesten was interviewed in Spontan gefragt about visual data communication
We are happy to share that Laura Koesten, PI of the Talking Charts project, has been interviewed by Markus Hengstschläger about her work in the program Spontan gefragt.
Read more
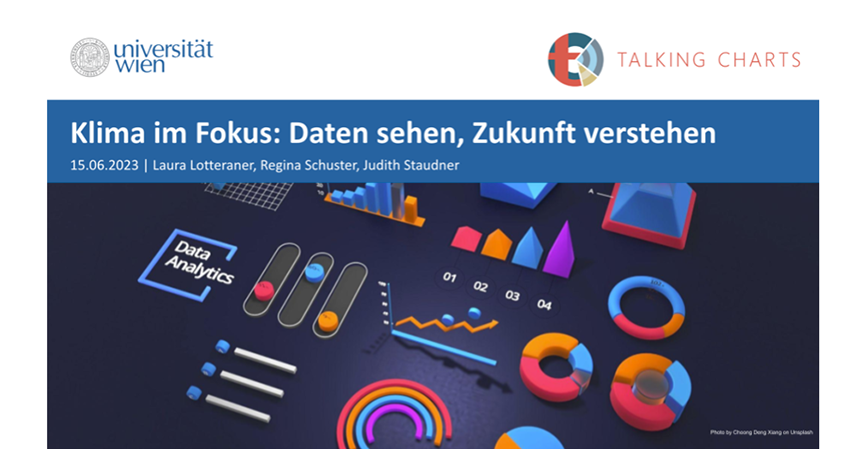
Workshop on Social Media Visualization at FMS im Zentrum
On June 15th, Laura Lotteraner, Regina Schuster, and Judith Staudner hosted a workshop on visualizing social media data at FMS im Zentrum, a public school in Vienna."
Read the blog post

Talk by
Jen Christiansen
On Sept. 01, 10:30 - 11:30 a.m., Jen Christiansen of Scientific American will give a talk on "Special Considerations for Science Graphics (from a journalist's point of view)."
More info
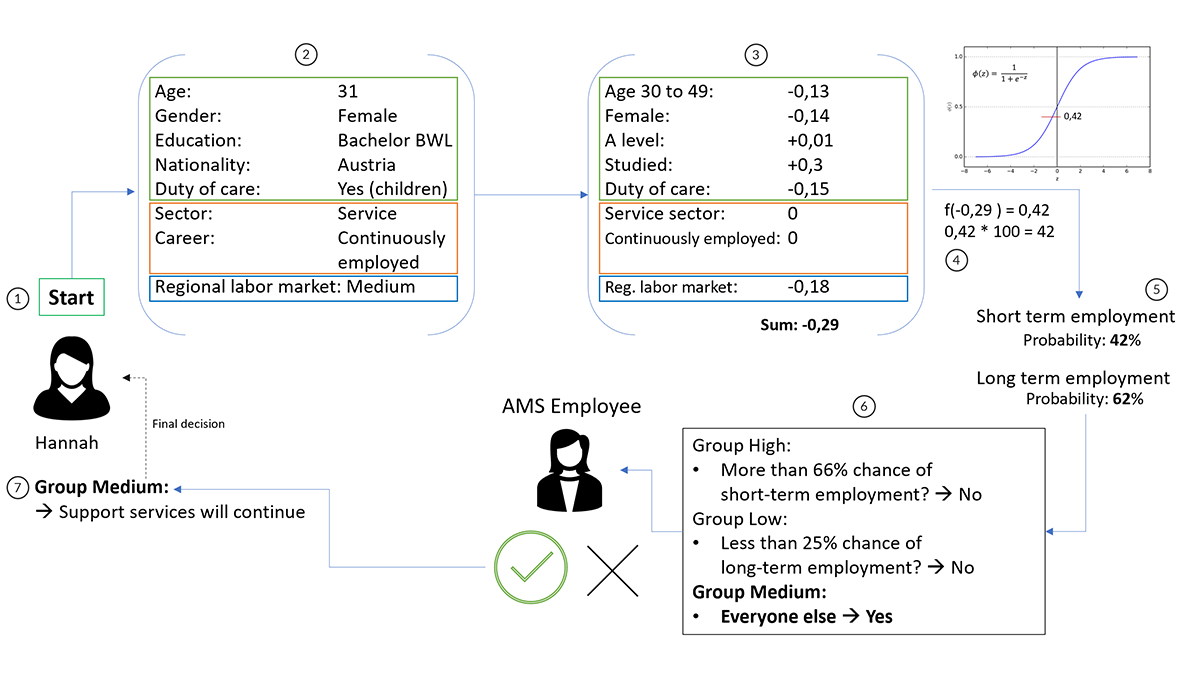
Congrats, Timothée Schmude!
Timothée's paper “On the Impact of Explanations on Understanding of Algorithmic Decision-Making” was accepted at ACM FAccT 2023! On the 14th of June, Timothée will present the paper at the conference’s venue in Chicago.
Read more
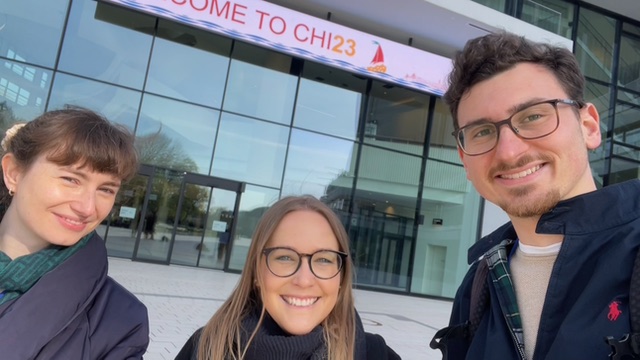
Congratulations,
Regina Schuster!
Regina just presented her paper “'The main message is
that sustainability would help' -- Reflections on takeaway messages of climate change data
visualizations" at the CHI 2023 Workshop on HCI for Climate Change: Imagining Sustainable
Futures in Hamburg.
Read
more
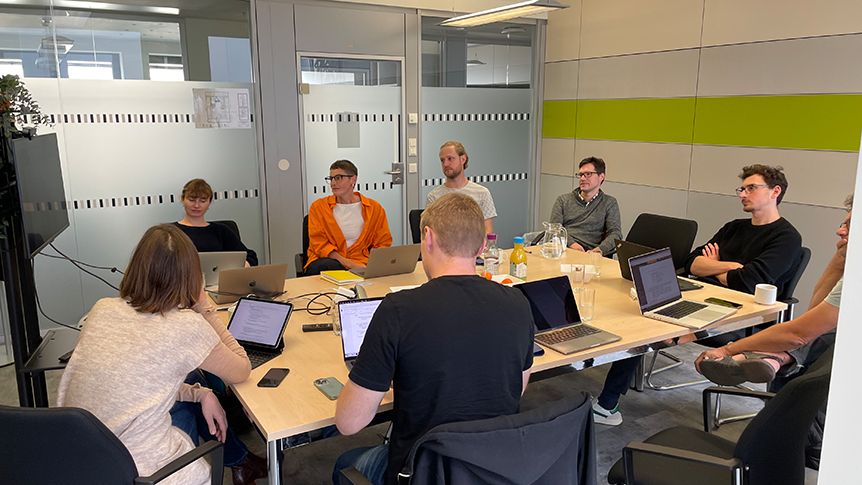
Connecting the Dots...
On September 21st we hosted our first Talking Charts Team Workshop.
Read Blogpost

Welcome Regina Schuster!
We are excited that Regina Schuster has joined our team as a PhD candidate!
Talking Charts @ Data Stories
On May 23rd Laura Koesten and Kathleen Gregory will be giving a talk on "Talking Charts: How are everyday visualisations produced and understood?"
Find out more

Come work with us!
We are hiring for six exciting new PhD positions at the University of Vienna, Austria.
Go to job posting
Coming soon!
Our projects will be starting on the 1st of November 2021.
View Details

Welcome Kathleen Gregory!
We are happy that Kathleen Gregory has joined our team at the University of Vienna!
